Matplotlib nestest pie chart 
Alexander Dunkel, Leibniz Institute of Ecological Urban and Regional Development,
Transformative Capacities & Research Data Centre (IÖR-FDZ)

The task in this notebook is to take this power point circle diagram and reproduce it with matplotlib.
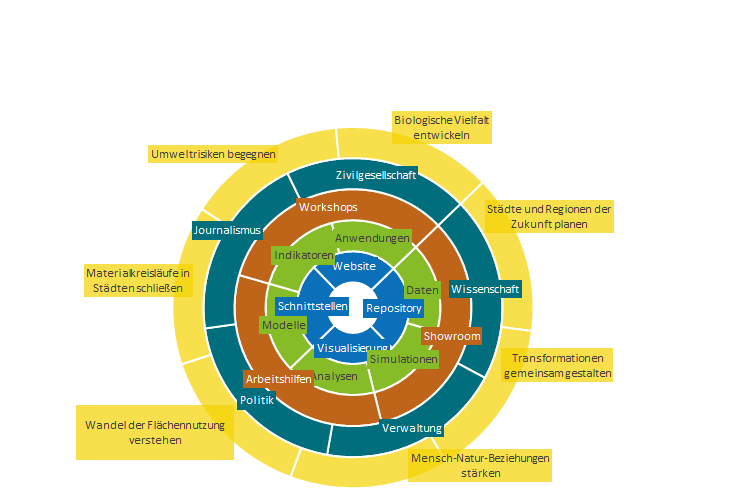
I first tried pyCirclize, but it did not work well. Matplotlib donut charts, on the other hand, are quite simple.
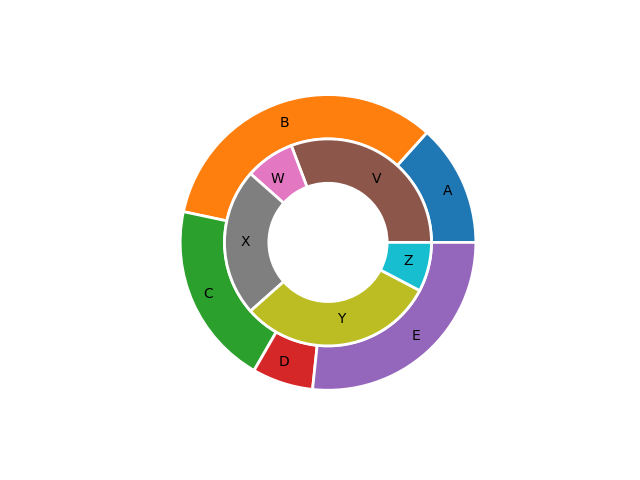
Nested Donut Charts Test
Import dependencies
import matplotlib.pyplot as plt
import numpy as np
from matplotlib import patheffects
from typing import List
Define Parameters
Colors
yellow = "#F8E04C"
green = "#006571"
brown = "#BE651A"
lightgreen = "#86BC27"
blue = "#0970B9"
General matplotlib pie chart parameters
General properties of circles:
width = 0.18
wedge_properties = {
    "width": width,
    "edgecolor": "w",
    'linewidth': 2}
Properties of bbox text background
bbox_props = {
    "linewidth": 0,
    "alpha": 0.7}
Text/ label properties
textprops = {
    "size": 14,
    "color": "k",
    "alpha": 0.9,
    "horizontalalignment": 'center',
    "bbox": bbox_props,
}
Combine general properties
pie_props = {
    "wedgeprops": wedge_properties,
    "textprops": textprops,
    "startangle": 40,
}
Define content
Starting with the outermost circle. For labeling, see: https://matplotlib.org/stable/gallery/pie_and_polar_charts/pie_and_donut_labels.html
v1 = [1, 1, 1, 1, 1, 1, 1]
labels1 = [
    "Biologische Vielfalt \nentwickeln",
    "Umweltrisiken \nbegegnen",
    "Materialkreisläufe in \nStädten schließen",
    "Wandel der Flächennutzung \nverstehen",
    "Mensch-Natur-Beziehungen \nstärken",
    "Transformation \ngemeinsam gestalten",
    "Städte und Regionen der \nZukunft planen"]
colors1 = [yellow, yellow, yellow, yellow, yellow, yellow, yellow]

v2 = [1, 1, 1, 1, 1]
colors2 = [green, green, green, green, green, green, green]
labels2 = [
    "Zivilgesellschaft",
    "Journalismus",
    "Politik",
    "Verwaltung",
    "Wissenschaft"]

v3 = [1, 1, 1]
labels3 = [
    "Workshops",
    "Arbeitshilfen",
    "Showroom"]
colors3 = [brown, brown, brown]

v4 = [1, 1, 1, 1, 1, 1]
labels4 = [
    "Anwendungen",
    "Indikatoren",
    "Modelle",
    "Analysen",
    "Simulationen",
    "Daten"]
colors4 = [lightgreen, lightgreen, lightgreen,
           lightgreen, lightgreen, lightgreen]

v5 = [1, 1, 1, 1]
labels5 = [
    "Website",
    "Schnittstellen",
    "Visualisierungen",
    "Repository"]
colors5 = [blue, blue, blue, blue]
Create pie plot
with 5 nested circles
fig, ax = plt.subplots(
    nrows=1, ncols=1, figsize=(12, 18))

# outer circle
bbox_props["color"] = yellow
textprops["color"] = "k"
ax.pie(
    v1, labels=labels1, labeldistance=1.15, colors=colors1,
    **pie_props),

# 4th circle
bbox_props["color"] = green
textprops["color"] = "w"

ax.pie(
    v2, labels=labels2, labeldistance=0.90,
    radius=1-width, colors=colors2,
    **pie_props)

# 3rd circle
bbox_props["color"] = brown
textprops["color"] = "w"
ax.pie(
    v3, labels=labels3, labeldistance=0.85,
    radius=1-width-width, colors=colors3,
    **pie_props)

# 2nd circle
bbox_props["color"] = lightgreen
textprops["color"] = "k"
ax.pie(
    v4, labels=labels4, labeldistance=0.80,
    radius=1-width-width-width, colors=colors4,
    **pie_props)

# inner circle
bbox_props["color"] = blue
textprops["color"] = "w"
ax.pie(
    v5, labels=labels5, labeldistance=0.60,
    radius=1-width-width-width-width, colors=colors5,
    **pie_props)

plt.show()

fig.savefig(
    "../resources/circle_v1.svg", format='svg',
    bbox_inches='tight', pad_inches=1, facecolor="white")
Customize text labels
Modifying labels can be done by getting wedges and texts from the pie.plot(). See the given example from the MPL docs.
bbox_props_alt = {
    "boxstyle": "square,pad=0.3",
    "fc": yellow,
    "ec": "k",
    "lw": 0
}

textprops_alt = {
    "arrowprops": dict(arrowstyle="-"),
    "bbox": bbox_props_alt,
    "zorder": 0,
    "va": "center",
    "size": 14,
    "color": "k",
    "alpha": 0.9,
    "zorder": 100,
}
def mod_labels(ax, bbox_props_alt, textprops_alt, labels, wedges, yoffset):
    """Add and style labels to pie chart"""
    for i, p in enumerate(wedges):
        ang = (p.theta2 - p.theta1)/2. + p.theta1
        y = np.sin(np.deg2rad(ang))
        x = np.cos(np.deg2rad(ang))
        horizontalalignment = {-1: "right", 1: "left"}[int(np.sign(x))]
        connectionstyle = "angle,angleA=0,angleB={}".format(ang)
        textprops_alt["arrowprops"].update(
            {"connectionstyle": connectionstyle})
        ax.annotate(
            labels[i],
            xy=(x, (y+yoffset)), xytext=(1.15*np.sign(x), 1.05*(y+yoffset)),
            horizontalalignment=horizontalalignment, **textprops_alt)
fig, ax = plt.subplots(
    nrows=1, ncols=1, figsize=(12, 18))

# outer circle
bbox_props_alt["fc"] = yellow
textprops_alt["color"] = "k"
wedges, texts = ax.pie(
    v1, colors=colors1, **pie_props)
mod_labels(ax, bbox_props_alt, textprops_alt, labels1, wedges, 0.02)

# 4th circle
bbox_props["color"] = green
textprops["color"] = "w"
ax.pie(
    v2, labels=labels2, labeldistance=0.90,
    radius=1-width, colors=colors2,
    **pie_props)

# 3rd circle
bbox_props["color"] = brown
textprops["color"] = "w"
ax.pie(
    v3, labels=labels3, labeldistance=0.85,
    radius=1-width-width, colors=colors3,
    **pie_props)

# 2nd circle
bbox_props["color"] = lightgreen
textprops["color"] = "k"
ax.pie(
    v4, labels=labels4, labeldistance=0.80,
    radius=1-width-width-width, colors=colors4,
    **pie_props)

# inner circle
bbox_props["color"] = blue
textprops["color"] = "w"
ax.pie(
    v5, labels=labels5, labeldistance=0.60,
    radius=1-width-width-width-width, colors=colors5,
    **pie_props)

plt.show()

fig.savefig(
    "../resources/circle_v2.svg", format='svg',
    bbox_inches='tight', pad_inches=1, facecolor="white")
Colorize path
Similarly, we can update the method to label/colorize different paths of the nested pie plot. As a start, we need to select the path by updating color lists per circle.
# purple = "#6E2F9D"
purple = "#591415"
colors1 = [yellow, yellow, yellow, purple, yellow, yellow, yellow]
colors2 = [purple, purple, purple, purple, green, purple, purple]
colors3 = [brown, brown, purple]
colors4 = [lightgreen, lightgreen, lightgreen,
           purple, lightgreen, purple]
colors5 = [purple, blue, purple, purple]
def mod_labels_color(ax, wedges, bbox_props, textprops, labels, colors, labeldistance, starting_textcolor, highlight_color):
    """Add and style labels to pie chart"""
    highlight = False
    if highlight_color in colors:
        highlight = True
    for i, p in enumerate(wedges):
        bbox_props_mod = bbox_props.copy()
        cur_col = colors[i]
        # p.set_path_effects(
        #     [patheffects.SimplePatchShadow(offset=(10, -10)),
        #      patheffects.Normal()])
        if cur_col == highlight_color:
            # we want text labels in selected
            # path to be shown with purple
            # color background and white text
            textprops["alpha"] = 0.9
            textprops["color"] = "w"
            bbox_props_mod["color"] = highlight_color
            # also highlight selected path by
            # adding a shadow to patches
            p.set_path_effects(
                [patheffects.SimplePatchShadow(offset=(10, -10)),
                patheffects.Normal()])
        else:
            # we want text labels not in selected path
            # to be shown without background color
            # and reduced alpha
            if highlight:
                textprops["alpha"] = 0.3
                bbox_props_mod["color"] = "none"
            else:
                # if no path is selected
                # use default values
                textprops["alpha"] = 0.9
                # highlight all paths (excluding the first) by
                # adding a shadow to patches
                if i>1:
                    p.set_path_effects(
                        [patheffects.SimplePatchShadow(offset=(10, -10)),
                        patheffects.Normal()])
            textprops["color"] = starting_textcolor
        textprops["bbox"] = bbox_props_mod
        ang = (p.theta2 - p.theta1)/2. + p.theta1
        y = np.sin(np.deg2rad(ang))*labeldistance
        x = np.cos(np.deg2rad(ang))*labeldistance
        ax.annotate(
            labels[i],
            xy=(x, y), **textprops)
def plot_pie(colors: List[List[str]], highlight_color: str):
    """Plot pie chart, highlight selected path"""
    colors1 = colors[0]
    colors2 = colors[1]
    colors3 = colors[2]
    colors4 = colors[3]
    colors5 = colors[4]

    fig, ax = plt.subplots(
        nrows=1, ncols=1, figsize=(12, 18))
    # outer circle
    bbox_props["color"] = yellow
    wedges, texts = ax.pie(
        v1, colors=colors1, **pie_props)
    mod_props = {
        "ax": ax,
        "wedges": wedges,
        "bbox_props": bbox_props,
        "textprops": textprops,
        "highlight_color": highlight_color,
    }
    mod_labels_color(
        labels=labels1, colors=colors1,
        labeldistance=1.00, starting_textcolor="k",
        **mod_props)
    # 4th circle
    bbox_props["color"] = green
    wedges, texts = ax.pie(
        v2, radius=1-width, colors=colors2, **pie_props)
    mod_props["wedges"] = wedges
    mod_labels_color(
        labels=labels2, colors=colors2,
        labeldistance=0.75, starting_textcolor="w",
        **mod_props)
    # 3rd circle
    bbox_props["color"] = brown
    wedges, texts = ax.pie(
        v3, radius=1-width-width, colors=colors3, **pie_props)
    mod_props["wedges"] = wedges
    mod_labels_color(
        labels=labels3, colors=colors3,
        labeldistance=0.55, starting_textcolor="w",
        **mod_props)
    # 2nd circle
    bbox_props["color"] = lightgreen
    wedges, texts = ax.pie(
        v4, radius=1-width-width-width, colors=colors4, **pie_props)
    mod_props["wedges"] = wedges
    mod_labels_color(
        labels=labels4, colors=colors4,
        labeldistance=0.35, starting_textcolor="k",
        **mod_props)
    # inner circle
    bbox_props["color"] = blue
    textprops["color"] = "w"
    wedges, texts = ax.pie(
        v5, radius=1-width-width-width-width, colors=colors5, **pie_props)
    mod_props["wedges"] = wedges
    mod_labels_color(
        labels=labels5, colors=colors5,
        labeldistance=0.15, starting_textcolor="w",
        **mod_props)
    plt.show()
    return fig
fig = plot_pie(
    colors=[colors1, colors2, colors3, colors4, colors5],
    highlight_color=purple)

Colorize different path
colors1 = [yellow, yellow, yellow, yellow, yellow, purple, yellow]
colors2 = [purple, green, green, purple, purple, purple, purple]
colors3 = [brown, brown, purple]
colors4 = [lightgreen, lightgreen, lightgreen,
           purple, lightgreen, purple]
colors5 = [purple, blue, purple, purple]
fig = plot_pie(
    colors=[colors1, colors2, colors3, colors4, colors5],
    highlight_color=purple)

Colorize no path
colors1 = [yellow, yellow, yellow, yellow, yellow, yellow, yellow]
colors2 = [green, green, green, green, green, green, green]
colors3 = [brown, brown, brown]
colors4 = [lightgreen, lightgreen, lightgreen,
           lightgreen, lightgreen, lightgreen]
colors5 = [blue, blue, blue, blue]
fig = plot_pie(
    colors=[colors1, colors2, colors3, colors4, colors5],
    highlight_color=purple)

Save to SVG and PNG
fig.savefig(
    "../resources/footprint_casereports_v5.png", dpi=300, format='PNG',
    bbox_inches='tight', pad_inches=1, facecolor="white")
fig.savefig(
    "../resources/footprint_casereports_v5.svg", format='svg',
    bbox_inches='tight', pad_inches=1, facecolor="none")
Create notebook HTML
!jupyter nbconvert --to html_toc \
    --output-dir=../resources/html/ ./2024-11-21_donut_mpl.ipynb \
    --template=../nbconvert.tpl \
    --ExtractOutputPreprocessor.enabled=False >&- 2>&-